Guest Post: Market Dislocation: Dow 11,908?

Submitted by Charles Hugh Smith from Of Two Minds
Market Dislocation: Dow 11,908?
I've got a bad feeling that the Great Intervention Rally of 2009 - 2011 is about to hit an iceberg.
January 2011 is eerily reminiscent of January 2000. Ignoring warning signs of being overheated and overloved, the stock market rose month after month, defying doubters.
With 12,000 within one good day's run, the Dow reached 11,908 in the week of January 10, 2000, and then rolled over. The next week it sprinted again for 12,000, hitting 11,834, but alas, the mighty advance was over. The S&P 500 topped out a few months later and then started down a relentless three-year slide.
I sense a dislocation coming in global markets. For goodness sakes, don't put any money on it (please read the HUGE GIANT BIG FAT DISCLAIMER below), as the timing of the dislocation is unknown.
Technically, we're in the zone where the Dow rolled over in 2000. Depending on whether you track weekly closes or intraday highs, that zone extends from about 11,725 to 11,908. As I type, the Dow is at 11,745.
That could be important, because that spike in 2000 looks like the left shoulder in a multi-decade head and shoulders pattern. The current Central Bank-goosed advance could be the right shoulder. If so, the coming dislocation could be deep and prolonged.
Here is a chart of the Dow JOnes Industrial Average, 1977 - 2011.

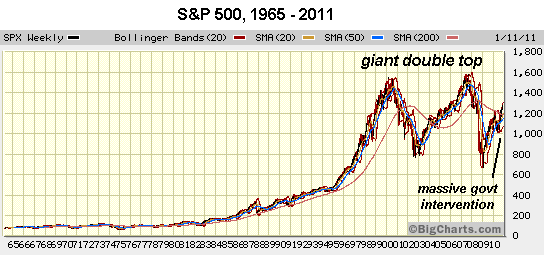
The S&P 500, meanwhile, has traced out a gargantuan double top. Optimists can discern the possibility of a triple-top, but I doubt the Central Bank interventions that have goosed the SPX to these heights can work their magic long enough to push the index 300 points higher to complete the triple top pattern. (As I type, the SPX is 1,285.)

Well, the clock is ticking, and the authorities have borrowed, printed and pumped unprecedented sums of money into the global economy to "get it through this rough patch" for two years.
Authorities are claiming the "recovery" is now "self-sustaining." Fine: then stop the QE2 goosing of the stock and bond markets, and cut Federal spending by $1 trillion, returning the deficit to "only" $500 billion a year rather than $1.5 trillion a year.
Does anyone seriously think the economy and stock market will continue "recovering" if the trillions in intervention and stimulus were pulled?
But as Panzner asks: what if the downturn is structural rather than cyclical? In that case, the central banks and Central State authorities are simply digging a deeper hole with every loan, every bailout, and every deficit.
Many of us have spent years describing the myriad ways that the global economy is indeed in a complex, interlocking chain of structural challenges. The idea that the imbalances in the global economy can be "cured" with permanently high levels of borrowing and spending and continued intervention to prop up equity markets is absurd.
Which brings us to the coming dislocation. The stock market is famously supposed to be a discounting mechanism which looks out six months. The Fed's QE2 POMO support of the stock market is set to expire in summer, so the market has at best five months of goosing.
Is the smart money going to wait until May to exit, stage left? Why take chances after a stupendous run-up since August? Why not take profits now and let the chumps play the game of holding on for the last dollar of profit?
I like the absurd precision of 11,908 as a target for the final stage of the Great Intervention Rally of 2009 - 2011. Maybe we get there, maybe not; but technically, we are in the sweet spot to roll over hard and complete the right shoulder of a long-term head and shoulders pattern.
If you prefer a fundamental-analysis reason for a dislocation, then please read the Wile E. Coyote Economy by David Rosenberg, via Zero Hedge.
As the Star Wars guys and gals said: I've got a bad feeling about this.

No comments:
Post a Comment