excerpt
Gallup Consumer Spending Data Refutes Commerce Department January Retail Sales Announcement
As if anyone needed more reasons to doubt the data coming out of our government. Earlier today the Commerce Department reported that January retail sales data came at a nice and bubbly 0.5% sequential increase, and an even nicer and bubblier 4.7% YoY. This presumably beat expectations which were looking for a sequential beat of 0.3%. Yet here comes the much more reliable Gallup data to throw some salt in yet another economic data fabrication. According to daily Gallup consumer polling, which due to its lack of proximity to the government propaganda complex is vastly more reliable, the January average data showed a decline of 5.8% over January 2009 and a whopping 16.3% decline over December. This is beginning to parallel the ever increasing divergence between the ABC consumer comfort index and the UMichigan index which lately seems to only track the average leve of the S&P over the prior month.
The chart below shows the true consumer spending behavior of Americans.

The gallup methodology is much more accurate than anything that could possible come out of the Commerce Department with its infinite data "adjustments."
Gallup's consumer spending measure tracks the average dollar amount Americans report spending or charging on a daily basis, not counting the purchase of a home, motor vehicle, or normal household bills. Respondents are asked to reflect on the day prior to being surveyed and results are presented here in both a 3-day and 14-day rolling average.
And here is how the Census Bureau determines its data:
The advance estimates are based on a subsample of the Census Bureau's full retail and food services sample. A stratified random sampling method is used to select approximately 5,000 retail and food services firms whose sales are then weighted and benchmarked to represent the complete universe of over three million retail and food services firms. Responding firms account for approximately 65% of the MARTS dollar volume estimate. For an explanation of the measures of sampling variability included in this report, please see the Reliability of Estimates section on the last page of this publication.
Feel free to decide whom you trust.
h/t Geoffrey Batt
excerpt shadow stats.

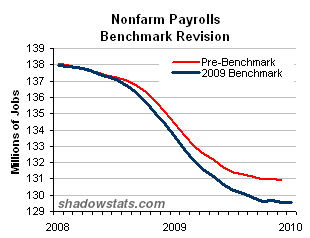
• 1.36 Million Jobs Knocked off December Payrolls; Depression's Job Loss Increased by 19% • January Unemployment: 16.5% (U-6), 21.2% (SGS)

No comments:
Post a Comment