4. Mr Geithner what a snake oil salesman but that is true for almost all the guys in DC
excerpt
Geithner Hints At State Bailout; Says "There Is No Way [A US Downgrade From AAA] Is Going To Happen"
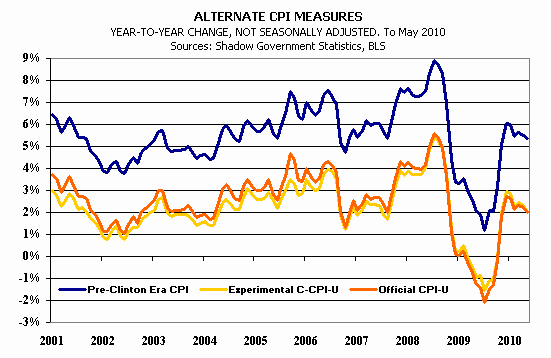
America was at least 2 times broke and the zero interest rate policy buys some time but at this very moment America does not even deserve any A as it is by real numbers already broke only the phony inflation numbers keep it a levels which gives rating agencies an excuse to keep up the rating. In real inflation terms the GDP would be far lower and interest rates at least 400 BP higher which would bring interest payments on the 10 tril plus to an additional 400 bil. in interest payments per year and the GDP debt ratio would be above 100% as of now already. This way trillions have been stolen from mainstreet over the years as they received far too low interest payments on their savings on the other hand it made the real estate bubble possible which gave the illusion of wealth and the financing was cheaper than under real conditions. bottom line is a lost decade which is much more drastic in real inflation terms. Mr Geithner
The other aspect is the shadow deficit which is a horror reality which is hidden from public announcements in the following you find some definitions and structure of the hidden debt which is many times the official hence America is already on junk bond level Mr Geithner .
excerpt 1
U.S. Government - Alternate Fiscal Deficit and Debt Reported by U.S. Treasury | | |||||||||
| Dollars are either billions or trillions, as indicated. Sources: U.S. Treasury, Shadow Government Statistics. | | |||||||||
| Fiscal Year (1) | Formal Cash-Based Deficit ($Bil) | GAAP Ex-SS Etc. Deficit ($Bil) | GAAP With SS Etc, Deficit ($Tril) | | GAAP Federal Negative Net Worth ($Tril) | | Gross Federal Debt ($Tril) | Total(2) Federal Obligations (GAAP) ($Tril) | | |
| 2008 | $454.8 | $1,009.1 | $5.1 | | $59.3 | | $10.0 | $65.5 | | |
| 2007 | 162.8 | 275.5 | 1.2 | (3) | 54.3 | | 9.0 | 59.8 | | |
| 2006 | 248.2 | 449.5 | 4.6 | | 53.1 | | 8.5 | 58.2 | | |
| 2005 | 318.5 | 760.2 | 3.5 | | 48.5 | | 7.9 | 53.3 | | |
| 2004 | 412.3 | 615.6 | 11.0 | (4) | 45.0 | | 7.4 | 49.5 | | |
| 2003 | 374.8 | 667.6 | 3.0 | | 34.0 | | 6.8 | 39.1 | | |
| 2002 | 157.8 | 364.5 | 1.5 | | 31.0 | | 6.2 | 35.4 | | |
excerpt 2
The gimmicked accounting standards, as established during the Johnson era, and as used today for official, unified budget reporting, show a 2003 deficit of $374.3 billion. Using GAAP reporting (without Social Security reporting), the official GAAP deficit for 2003 expands to $665.0 billion. Including accounting for Social Security and related areas, the 2003 deficit balloons to $3,702 billion, or $3.7 trillion.[2] The accounting reflects no adjustment for the new, more expensive Medicare program.
As an aside, if you download[3] a copy of the financial statements, the GAO’s auditor’s letter as to why they won’t certify the statements is an exposé of significant financial mismanagement within the federal government.
Beyond the $3.7 trillion deficit in 2003, however, the numbers get even worse, because the shadow deficit has been taking its toll ever since the Johnson era. According to the Treasury’s 2003 financial statement, the U.S. government has a negative net worth of $34.8 trillion. That $34.8 trillion reflects $36.2 trillion in financial liabilities offset by $1.4 trillion in assets, of which only $0.4 trillion are liquid.
excerpt 3As of August 2004, Fitch gave the "AAA" rating to only 15 countries, including the United States. The other 14 are Austria, Canada, Denmark, Finland, France, Germany, Ireland, Luxembourg, Netherlands, Norway, Singapore, Sweden, Switzerland and the United Kingdom. Of those 14, five ran budget surpluses in 2003, including Canada, Denmark, Finland, Norway and Sweden. The worst deficit as a percent of GDP was for France at 4.1%, followed by Germany at 3.5%. In contrast, the not-generally-recognized GAAP U.S. deficit in 2003 was 34.2%.
Similarly, the highest level of debt to GDP seen among the 14 other "AAA" countries is at 75.6% for Canada, followed by France at 71.1%, Germany at 65.1% and Austria at 64.9%, versus a GAAP ratio of total financial obligations to GDP of 334.3% for the United States. The low ratio among the "AAA" countries is Luxembourg at 4.9%.
excerpt 4

No comments:
Post a Comment