1. Sentiment remains at top levels as we are heading for an unpleasant Full Moon plus 20 year clash pattern on the 17th respectively 23rd.
excerpt
excerpt
| MONDAY, FEBRUARY 14, 2011 | ||||||||||||||||||||||||||||||||||||||||||||||||||||||||||||||||||||||||||||||||||||||||||||||||
INVESTOR SENTIMENT READINGS High bullish readings in the Consensus stock index or in the Market Vane stock index usually are signs of Market tops; low ones, market bottoms.
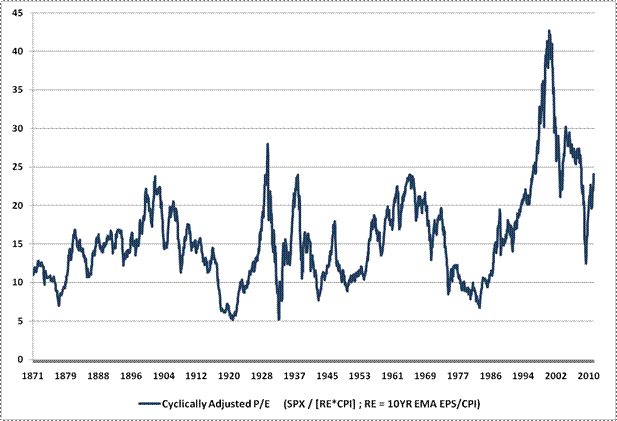
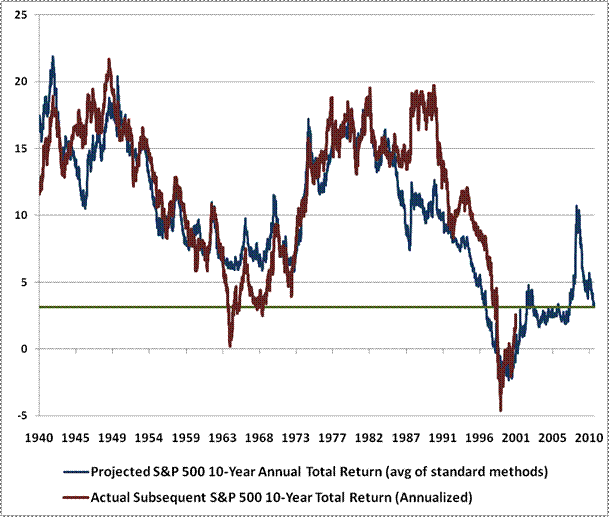
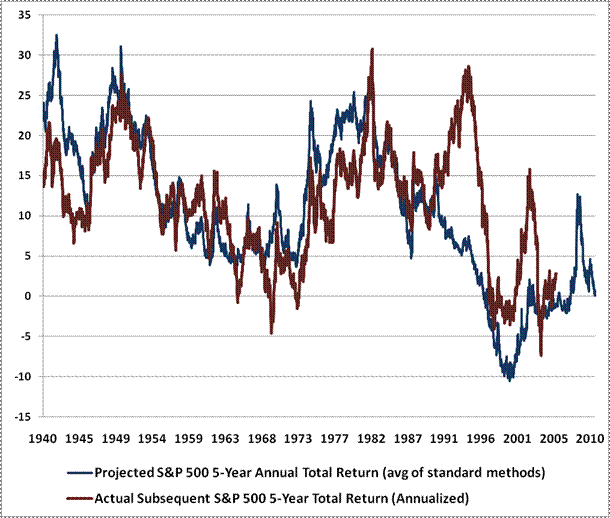
FC Market Sentiment is a proprietary indicator derived from actionable sell-side trade ideas sent by the sell-side to their buy-side clients over the First Coverage platform. Over 1,000 institutional sales people at more than 250 firms participate on the First Coverage platform and have contributed hundreds of thousands of ideas since inception. Each Idea is associated with a ticker or sector and is tagged bullish or bearish by the creator. This data is aggregated at the sector, industry and market level. The FC Market Sentiment score ranges from 0-100 (0=most bearish, 50=neutral, and 100=most bullish) and represents a completely objective, real-time view into what advice the sell-side is providing to their buy-side clients Citigroup Panic/Euphoria Model  2. Valuation concerns excerpt February 14, 2011 Rich Valuations and Poor Market Returns John P. Hussman, Ph.D. All rights reserved and actively enforced. Reprint Policy Last week, the S&P 500 Index ascended to a Shiller P/E in excess of 24 (this "cyclically-adjusted P/E" or CAPE represents the ratio of the S&P 500 to 10-year average earnings, adjusted for inflation). Prior to the mid-1990's market bubble, a multiple in excess of 24 for the CAPE was briefly seen only once, between August and early-October 1929. Of course, we observed richer multiples at the heights of the late-1990's bubble, when investors got ahead of themselves in response to the introduction of transformative technologies such as the internet. After a market slide of more than 50%, investors again pushed the Shiller multiple beyond 24 during the housing bubble and cash-out financing free-for-all that ended in the recent mortgage collapse. And here we are again. This is not to say that we can rule out yet higher valuations, but with no transformative technologies driving the economy, little expansion in capital investment, and ongoing retrenchment in consumer balance sheets, I can't help but think that the "virtuous cycle" rhetoric of Ben Bernanke is an awfully thin gruel by comparison. We should not deserve to be called "investors" if we fail to recognize that valuations are richer today than at any point in history, save for the few months before the 1929 crash, and a bubble period that has been rewarded by zero total return for the S&P 500 since 2000. Indeed, the stock market has lagged the return on low-yielding Treasury bills since August 1998. I am not sure that even members of my own profession have learned anything from this.  Based on our standard methodology (elaborated in numerous prior weekly comments), we presently estimate that the S&P 500 is priced to achieve an average total return over the coming decade of just 3.15% annually. Again, we've seen weaker projected returns over the past decade. But then again, the S&P 500 lost about 5% annually in the decade following the 2000 peak, and even including the recent advance, has achieved an annual total return since 2000 of almost exactly zero. So despite periodic speculative runs, rich valuations have an annoying way of ruining the fun. Equally important, even during extended speculative periods as we observed in the late-1990's, those advances have tended to suffer deep and abrupt intermediate-term corrections once elevated valuations are joined by overbought conditions, overbullish sentiment, and rising interest rates, as we observe today.  Though our standard methodology is less accurate at horizons shorter than about 7 years, the main sources of that reduced accuracy are those two "bubble" advances, one during the 1995-2000 period, and the other during the 2005-2007 period. Both of those were certainly encouraged by easy monetary policies, but both were also accompanied by strong expansion in debt-financed consumer and business spending. At present, investors rely on the emergence of yet another valuation bubble in order to perform better than the expected return of zero that is now priced into stocks for the coming 5-year period.  The Strategic Growth Fund and Strategic International Equity Fund remain tightly hedged here, but it bears repeating that our defensiveness at present is not driven by valuation considerations alone, nor by our broader concerns about underlying debt and mortgage conditions. Rich valuation is strongly associated with weak subsequent returns, but only reliably so over periods of 7-10 years. In contrast, the present syndrome of overvalued, overbought, overbullish, rising-yield conditions is typically associated with abrupt and often steep losses, but is more commonly resolved over a period of months rather than years. I wish that I could report that we've found some method to "time" these often abrupt resolutions more precisely, but we haven't. So we are forced to deal with average outcomes rather than specific forecasts. While we can certainly find analysts who believe stocks are cheap, we can easily test the long-term accuracy of their methods (which often amount to nothing more than applying an arbitrary multiple to forward operating earnings, or dividing the forward earnings yield by the 10-year Treasury yield). Frankly, many of those alternative methods stink. Regardless of whether an analyst claims that stocks are cheap or expensive, they should be expected to provide some sort of evidence that their methods have a strong relationship with subsequent market returns. I should note that there is good support for incorporating trend-following factors into market analysis, but even trend-following methods tend to be counterproductive once overvalued, overbought, overbullish, rising-yield conditions are observed. When market declines are abrupt, the most extended point in the trend is also the point of greatest risk. In contrast, when the market is free from the hostile syndrome we observe here, it's often possible to get some amount of "warning" about potential trouble from gradual deterioration of market action and a tendency for various "divergences" to develop as risk aversion increases. On average, the syndrome of conditions we presently observe has been hostile for stocks. Once we clear some component of this syndrome (and assuming that market internals don't simultaneously deteriorate markedly), we'll have some latitude to accept moderate exposure to market fluctuations. We haven't ruled out the possibility of yet another bubble, and we won't maintain a tightly defensive position except under conditions that have produced negative average returns. But here and now, we remain defensive. The long-term outlook is weak on the basis of valuations, and the expected near-term return/risk profile is negative on the basis of the specific but probably short-lived set of conditions we observe. The intermediate term (1-2 years) is uncertain, but we'll take that evidence as it comes. In bonds, the Market Climate last week remained characterized by relatively neutral yield levels and unfavorable yield trends. As expected, the seasonally-adjusted monetary base has surged by $150 billion since the beginning of the year, while the actual monetary base has increased by $100 billion. It is notable that the 3-month Treasury bill yield dropped to 0.11% from 0.15%, which is actually a good sign in the sense that it will facilitate the willingness to hold the additional base money the Federal Reserve has created in recent weeks without immediate inflation pressures, though it clearly comes at the expense of individuals on fixed incomes who rely on interest on certificates of deposit and the like. That said, back in 2008, about 95% of the monetary base represented currency in circulation. Since then, the Fed has created a great deal of base money in the form of reserves, but it has also increased the amount of currency in circulation by 20%. While it's clear that the Fed would like lawmakers and the public to believe that it has exquisite control of the monetary base, it is much harder to control currency in circulation than it is to control bank reserves. We usually use the word "robust" to describe conditions that aren't easily affected by small changes in outside factors, and "unstable" to describe conditions that are highly sensitive to things working out just right. At present, my view on monetary policy is that the inflation outlook following the completion of QE2 will be quite unstable, because small changes in interest rates are likely to induce very large changes in the willingness of individuals to hold base money (seeSixteen Cents). Any external upward pressure on interest rates beyond a fraction of a percent will have to be rapidly offset by a large reduction in the outstanding monetary base in order to avoid a deterioration in the value of money relative to goods and services (i.e. inflation). The U.S. economy has never been willing to hold more than 10 cents of base money per dollar of nominal GDP except when interest rates were substantially below 2%. The Fed is now pushing the monetary base toward 16 cents of base money per dollar of GDP. If we observe any material upward pressure on yields (which we already observe internationally and at the long end of the maturity curve), the monetary challenges may be substantial. Other Notes On the subject of the recent turmoil in Egypt, my impression is that it is incorrect to view these strains as being specific to Mubarak's government. The discontent spreading from North Africa to the Middle-East, India, Pakistan, and beyond is largely driven by economic strains, particularly unemployment and perceived inequality. None of these are confined to those countries, but are instead global in nature. There is a widening gap between individuals who have benefited from the policies of governments and those who have seen little relief, and that gap is particularly wide in autocratic countries where people have inadequate ability to change those policies or to voice their political opposition. What seems at first glance to be a crisis in Egypt actually started in Tunisia in mid-December, when a 36 year old unemployed man publicly set himself on fire, sparking anti-government protests that resulted in the ouster of Tunisia's autocratic president. Since then, there has been a wave of self-immolations in Algeria, Egypt, Pakistan, Punjab and elsewhere, by people who feel that they have no voice to counter what they have alternatively described as "injustice, oppression and lack of equality," or "poverty, corruption and unemployment." Broader social discontent has also been focused on the soaring prices of essential commodities such as oil and sugar (which is not unrelated to the commodity hoarding that results from negative real interest rates induced by quantitative easing). For me, all of this brings to mind some remarks that my friend Thich Nhat Hanh, a Buddhist monk, once made concerning the Vietnam war. He said that in Vietnam, some monks "even had to burn themselves in order for the world to listen." That phrase "had to" has always weighed heavily for me. When we live our lives in a way that refuses to listen to the suffering of the world, we create consequences that we cannot imagine to be any part of our intent. As Thay remarked, "The monk who burns himself has lost neither courage nor hope... he believes in the fruition of his act of self-sacrifice for the sake of others. I believe with all my heart that the monks who burned themselves did not aim at the fatality of their oppressors but only at a change in their policy. The monks' enemies are not of flesh and bone - their enemies are things like intolerance, fanaticism, dictatorship, cupidity, hatred, and discrimination which can be found in the heart of men. On June 11, 1963, Thich Quang Duc showed the world that it is not the right of man to cause suffering for another human being." To be honest, I have no particular policy recommendation, no prediction of where strains might emerge next, nor any forecast about how all of this may affect the financial markets. My only thought is that none of us would do badly to listen more intently to the suffering of the world around us - even in our own country - and to make a greater effort to address it in whatever circle of influence we have. | ||||||||||||||||||||||||||||||||||||||||||||||||||||||||||||||||||||||||||||||||||||||||||||||||

No comments:
Post a Comment