Excerpt
Stock Ind analystexes Confirm Strength into 2010
By Jim Curry - Published 12/02/09
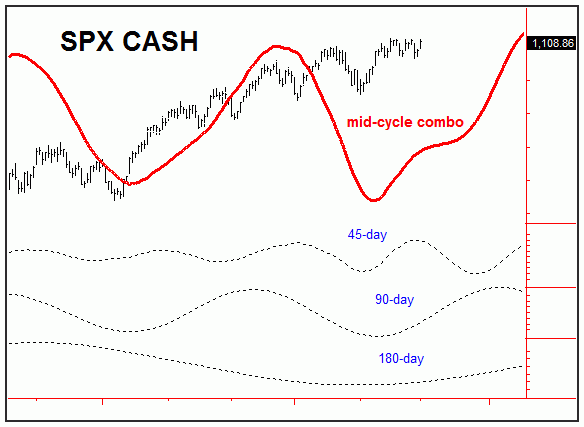
Going back to the mid-July period of 2009, the time cycle work that I track had confirmed the 07/08/09 low as a combination bottom with the 45 and 90-day cycles. Using a statistical analysis of the larger 90-day component, the probabilities favored that this particular cycle would not see it's following peak made prior to the late-September or early-October period - and thus the assumption was that the SPX was headed toward the low-1100 level or better into October.
After moving into the October, 2009 period, there was then a larger combination bottom with both the 90 and 180-day components that was due around mid-November, but with a plus or minus of approximately 2 weeks in either direction - due to the variance larger 180-day cycle. In terms of price, a normal 90/180-day downward phase will usually see a decline of 10%-or-better off the top - and thus the expectation was for a potential decline in this range before our larger combination low was finished. The actual decline ended up being in the range of 6.5%, which fell short of expectations - possibly due to the positive seasonality.
Key resistance for the month of November was noted at or near the 1069 level on a closing basis - which was the monthly projected resistance high for the SPX CASH index. When prices closed on this figure at the closing of trading on 11/06/09, then there was the potential for our 90 and 180-day combination bottom to be in place; this was then confirmed the very next trading session.
With the above, our larger 90 and 180-day combination wave is now deemed to be headed upward into January of 2010, as shown on the updated forecast wave below:

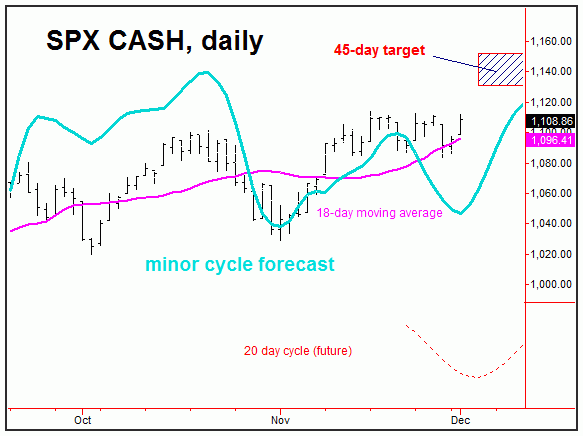
Even with our larger bottom confirmed in place on 11/9/09, in our daily outlooks I did note that a secondary low would likely be seen in the late-November timeframe - due to a nominal 20-day cycle that was projected to bottom near the November 27th period. The minor cycle forecast chart (below) suggested this low well ahead of time:

The expectation for the downward phase of the 20-day component is that it would see a retracement back to or below the 18-day moving average - which this cycle will do better than 95% of the time before bottoming out.
Right now, the minor cycle forecast is looking for continued strength in the coming days. This minor cycle forecast is essentially unchanged from what it was projecting back in September, and the market has followed the roadmap extremely well since this time.
Stepping back, the basic suggestion for the mid-term picture is for higher highs to be made into January, 2010. There is an outstanding upside target from the 45-day cycle to the 1130.09 - 1153.63 level on the SPX; this range is also likely to be the area that tops this same 45-day component.
For the longer-term, the key figure for the SPX is the 1122 level (closing basis). That number is the approximate 50% retracement of the entire move down from the October, 2007 high to the March, 2009 bottom. That is, it will take a firm daily close above this level for the larger 90 and 180-day cycles to gain momentum into the Spring of 2010 (where the 180-day component is next set to peak). Otherwise, holding below the same will continue to keep the action very choppy (sideways) for the near-term.
Stepping back even further, 2010 is setting up for what should be a very important peak - one that should top the entire countertrend retracement off the March, 2009 bottom. That top should then give way to an eventual breach of the 666.79 low on the SPX - ideally to move on down to a longer-term 'swing support' area at the 580-620 level on this index. There is a much-larger 36-year wave that is projected to bottom in the late-2010 timeframe - but which could easily stretch out into 2011 or 2012, simply based on the very large average variance with this particular cycle. More on this in a future article.
Jim Curry
Market Turns Advisory

No comments:
Post a Comment